Statistics for Programmers
As a programmer you want to know how your programs affect the world, when you do a change to the code and deploy it you want to know how it would affect your users, if you have many users and you use canary deployments and gradual deployments you want to know if this 1% of users that received your feature were they happy or not, this 1% is a sample, is this sample good enough? Can you infer from it to the broad population of your users? For this we need to know how to do sampling good, and to check if our sample is good or not, yes as programmers we also need to know about confidence intervals and the central limit theorem and hypothesis testing - but hold on we are not mathematicians we are programmers, this why this is for you because this is statistics for programmers.
From reality to numbers to representative numbers to inference and testing with samples what is the true reality
We are especially interested in the relation between samples to the actual population, so that we can take samples of our users for example and deduce from it on the whole population.
We are collecting evidence from samples the more evidence we have the more confident we are in our actual population mean.
We use numbers to describe our world, in statistics we try to organize and understand the numbers and take conclusions and ask questions on them.
We cannot see the whole population numbers, so we use sampling.
Looking at all the numbers or charts is not enough, so we try to come up with a very few numbers like the mean and medium which is a single number describing our whole dataset.
Another number is telling us how do all the numbers we have related to the simple single number we have the standard deviation is the average distance for each data point and the mean of the dataset. How much variation we have in our data.
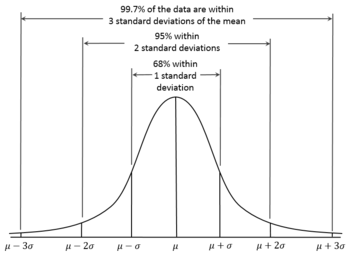
Normal distribution means our data is symmetrically distributed around the mean, so we can look at a picture, and we can estimate how many numbers we expect at a certain part of the distribution.
We expect about 68% of our data to be around 1stddev from our mean, we expect 95% of data to be around 2stddev of our mean.
def zscore(specificDataPoint) = stdDev(dataPoint) // from the mean.
z-scores are for a specific data point how many stddev is it from mean.
Probability is the ratio
It's just a ratio of a particular for all possible outcomes. In some cases we need to know the probability of multiple events to occur.
If we need to know the probability of multiple evens happening, or the probability of even B given even A, the latter is conditional probability.
Random experiments what is the outcome of experiment of rolling a die.
Random variable - the numerical outcome of a random experiment 5 or 6.
Discrete outcomes - 1,2,3,4, ...
Continuous outcomes - The temperature.
Binomial experiments, in each experiment we have only 2 possible outcomes - like the stock would raise or the stock price would fall.
How many users should we sample
The larger the sample size the more accurate and more confident we are that the sample is giving us a hint into the population. The standard deviation of the sample is the average of points from the mean - the mean of the sample the larger the sample the larger n is the larger n is then the standard deviation becomes smaller of the sample.

n is the sample size the bigger the sample size the smaller the standard deviation.
Central Limit Theorem
Take more samples! Take more sample groups! To get closer to the population mean.
Encourage us to take samples to estimate the population mean.
Trust your samples to point you in direction of population mean.
Assures you get a great estimation of population mean from samples given you take enough samples.
Could we use samples to direct us to the population mean?
If we do 3 sample groups we take the average of each sample group, in each sample groups we take a few samples like sample size n=4
k groups - 3 sample groups.
The more samples we take the closer the sample mean to the population mean.The sample groups mean would start to look always like a normal distribution even if the original population is not of normal distribution.
If you increase sample size => the curve becomes more normal the curve is taller and narrow so stddev is smaller.
The larger the sample size the more confidence we have in our results.
Standard error
Standard deviation of the sample mean
So we deployed a new feature, and we want to know how many are happy, we can't ask all our users, so we are going to sample our users and ask them : "are you happy with this new feature?"
As we don't know the real population mean answer we estimate that each sample has a standard error and it relates to the sample size.
If we say that we have normal distribution to the mean of the samples than we know that 68% of sample means would fall within 1 standard deviation of the population mean.
We plug the n to the above formula.
The standard error allows us to set a range around the population proportion p + stddev and p - stddev this is the standard error. If so is we see that in our samples 68% of our sample means are not within the 1 standard deviation it could be that we have a problem in sampling or can tell us that the experiment results is different.
Connect the sample to population
Sample and Population Relation! Standard deviation of our sample means (standard error) is standard deviation of actual population divided by sqrt(n) sample size.
Standard error/Formula


Confidence Interval
A number that tells you how confident you are in an interval. Confidence intervals are all aobut :
1. Do a sample
2. Calculate the mean / proportion of the sample.
3. Calculate an interval round that sample mean
Now depending on the CI we choose 95% for example we then use the formula for the SE only this time it's not SE it's the sampling error and with combination with z score we calculate an interval for which we are going to be 95% sure that the actual population mean would be in that interval.
When we say we are 95% sure are we really sure, we could only be sure if our sampling is true random sample, we can only be sure if users don't change their mind if it's a view of someone we ask for, and then he changes his mind then the sample we did it's not a true random sample that's what happens in polls in politics the pollers say 95% but people are lying people don't go to vote so it's not really 95% assurance.
And what does it mean to be 95% sure of something, that means that if we did the same sample 20 times we are sure that our process would yield the true population vote or result 19 out of 20 samples, because we are only sure 100% of this pole outcome!
Hypothesis Testing
Is it real or fake news, is this thing that happened really likely or is it not likely to occur. How likely is it that a new medicine on COVID-19 that made a few patients recover a few days sooner means it's significant or a result of change.
Significant - Did this just happened by chance or is there something into it, something really happened here and not a mere chance.
We gather data and samples, and we try to deduce if it's significant or not if its true news or fake news.
H0 - null hypothesis the status quo, everything is as usual nothing into it, it's only happening by chance.
Ha - Something special happened here, it's not a mere chance we have real news here.
Significance Level (alpha) - threshold that would mean Ha is true. Let's say 5%
If the event you see has less than 5% of chance to happen then something is new here we have news so we don't reject the null hyphothesis
If the outcome we saw as evidence has less than 5% chance (significance level alpha we choose) then we say Ha is true something is strange here.
Pvalue the probabbility that the outcome we saw would occur by chance. let's say we find it's 2%
So 2% < 5% so Pvalue is 0.01% that this even would occur by chance, and as the percentage of Pvalue 2% so it's less than 5% so this is very uncommon, so we reject the null hypothesis we think that something is smelly here, and we have real news. Does not prove anything just means we reject the null hypothesis.
And yet again we look at the normal distribution the zscore pvalue (event would happen by chances, so nothing new here). Where is the event we see on standard deviation based on normal distribution.
Comments
Post a Comment